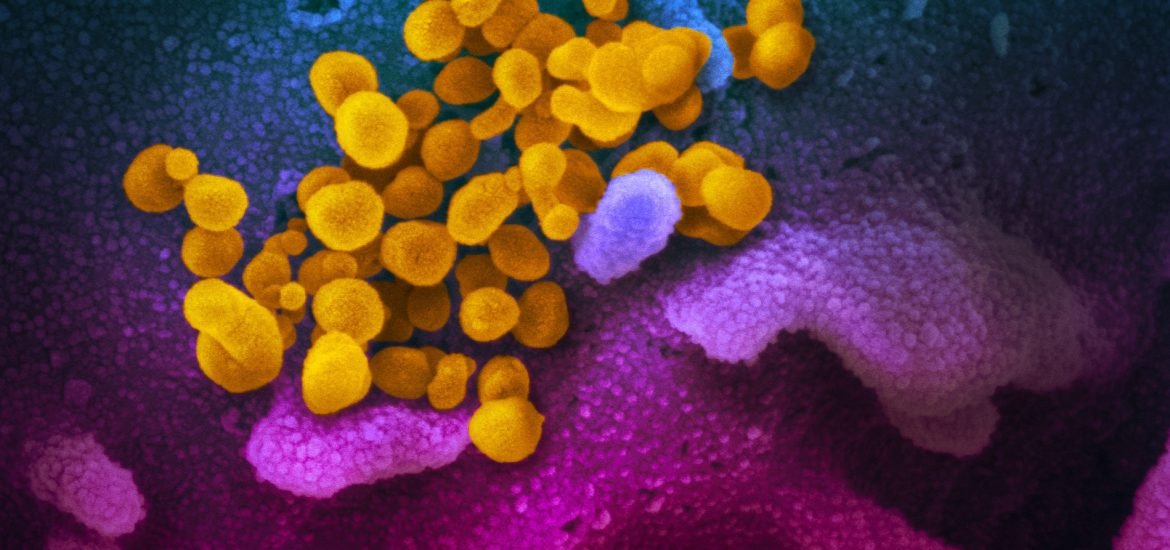
SARS-CoV-2, the new severe acute respiratory syndrome (SARS), caused by the 2019 coronavirus (COVID-19), isolated for the first time in Wuhan in China in December 2019, continues to wreak havoc, is spreading day by day, and threatens to become a serious pandemic.
Number of official cases in China
The number of new official daily cases in China is decreasing and this is pretty much the only good news…
Nevertheless, it is necessary to exercise a certain caution because the propensity of the Chinese Communist Party to publish picturesque figures – in particular its provincial economic statistics – is well known. Supposedly, the Chinese authorities do not suppress information (or not as much?) since at least mid-January.
We should also note that the Chinese had RNA test kits (PCR tests) in limited quantity. This prevented diagnosing all patients with the guarantee of a genetic test. Some patients were diagnosed by radiography (CT scans). The Chinese authorities did not count the latter at first.
Prior to February 10, 2020, the data only included cases from Hubei province (capital Wuhan) that had been genetically tested for the virus (proven cases). After that date, it includes cases clinically diagnosed on the basis of medical imaging showing signs of pneumonia (clinical cases). Laboratory-tested data was also available separately from February 10 to 15, 2020.
As of February 16, 2020, the confirmed cases are no longer broken down between clinical cases and genetically tested laboratory cases (proven cases). And from February 19, 2020, only the new cases tested in the laboratory were counted in the totals (but the clinical cases counted earlier were not excluded).
While the number of deaths is probably reported more or less accurately, the same cannot be said of the sick: it is trickier to hide a dead body than a sick patient. In addition, the vast majority of people have mild symptoms: most patients did not stay in the hospital. They waited at home for the symptoms to wane. The authorities of a dictatorial country did not hasten to count them all.
The reason why the number of actual cases is higher than the number of confirmed cases (proven and clinical cases) is not (only) due to a conspiracy to silence the media and dissidents but also a consequence of all these facts.
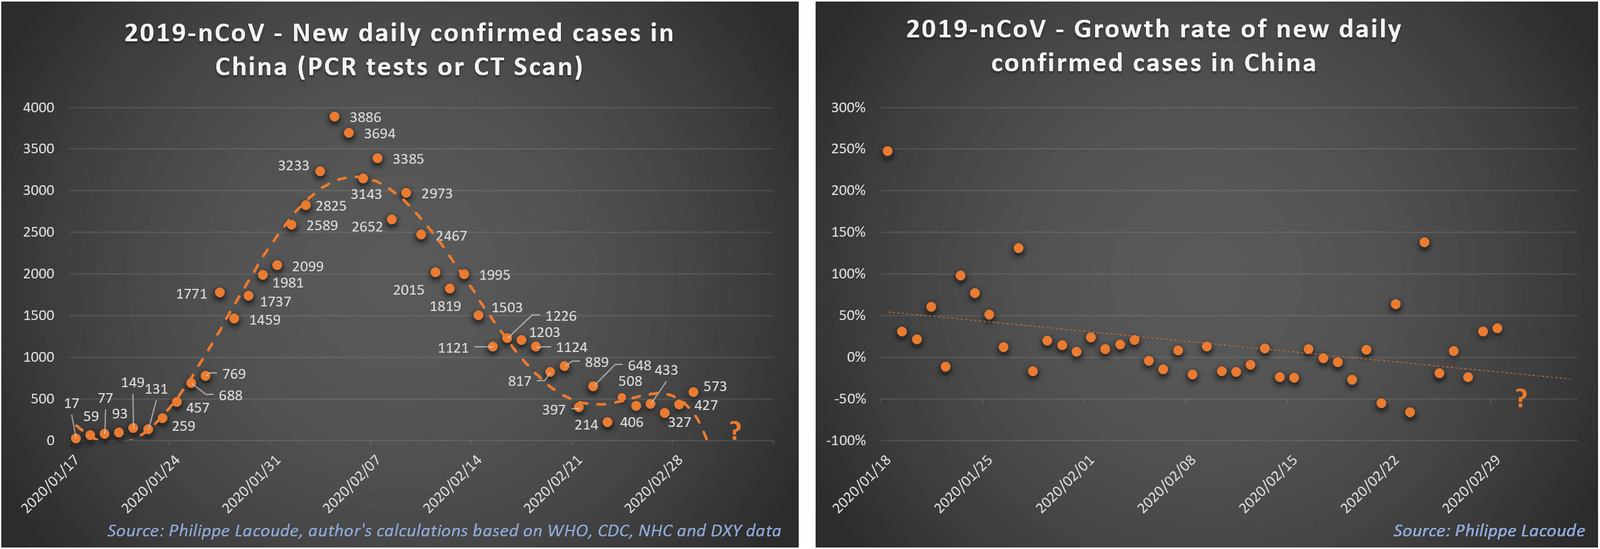
If we examine the confirmed cases (by RNA tests or by CT scan), we note that the growth rate of the epidemic of COVID-19 virus is slowing down in China. It only took 2.5 days to go from 4,250 to 8,500 confirmed cases. It then only took 3.5 days for the confirmed cases to increase from 8,500 to 17,000. It took exactly 5 days to double the number of confirmed cases from 17,000 to 34,000 on February 7, 2020. The next doubling – to 68,000 cases – took 8 days and, still, these cases include those diagnosed by radiography whereas before it was only by genetic tests.
Number of actual cases
As we pointed out in a previous paper, the number of actual cases is far superior to the proven cases.
As of January 12, 2020, at which time only 30 cases were reported by the authorities, there were already a total of 1,723 actual cases of COVID-19 in the city of Wuhan, with a 95% confidence interval (CI) from 427 to 4,471, according to a statistical analysis from Imperial College, London.
As of January 20, again according to the same group, a total of approximately 4,000 cases of COVID-19 had symptoms while the authorities counted only 291.
As of January 25, John Hopkins University estimated that there were 20,000 actual cases of COVID-19 in China. According to Lauren Gardner: “The simulation model is run for a time period between the start of the outbreak, up until January 25. We then estimate the expected number of cases in mainland China, as well as the global distribution of the infected travelers. We estimate 40 cases of [COVID-19] to have been exported outside of mainland China by January 25, as was reported, at which point we believe the number of [COVID-19] cases in mainland China are likely much higher than that reported throughout January. Specifically, we estimate there to be around 20,000 cases of [COVID-19] in mainland China on January 25 (at which time closer to 2,000 were reported). We also estimate there were already hundreds of human cases of [COVID-19] in Wuhan in early December.”
As of January 25, according to a Lancet article, a complete modeling brought out the number of actual cases to approximately 75,815 individuals (with a 95% CI of 37,304 to 130,330 cases) with a basic reproductive ratio R0 of only 2.68 (with a 95% CI of 2.47 to 2.86) and an estimated doubling time of the epidemic of 6.4 days (with a 95% CI of 5.8 to 7.1 days). In retrospect, more recent studies have shown that the doubling time was much shorter and the reproductive ratio probably twice as large. However, on that same day, the authorities were counting only 1,975 cases.
Also on January 25, researchers from the Shenyang Institute of Computing Technology estimated that the new 2019 coronavirus had infected 61,596 people (with a 95% CI ranging from 58,344 to 64,847 cases) in Wuhan. Wuhan residents had already exported 170 cases to Guangzhou, where the number of actual cases was probably close to 315.
As of February 29, the actual cumulative number of infections in Wuhan could have been as high as 227,989 cases, or at least three times the number of confirmed cases!
Therefore, all the studies coincide: about a month ago, the epidemic was 10 to 30 times greater than the number of confirmed cases.
Of course, the Chinese Communist Party is probably hiding the magnitude of the problem (as indicated by the disappearances of political activists critical of the regime). But it is also almost impossible to count the number of patients affected by a disease whose symptoms are sometimes mild. The counting system – assuming the numbers are not tampered with – continues to change, paradoxically, in part because the Beijing authorities are trying to satisfy critics.
Another fundamental reason why the numbers of actual cases are so different from those of proven cases is that the RNA test kits (PCR) were not available in sufficient quantity.
This is not a criticism of the Chinese regime. The RNA code of the virus was established in record time compared to previous sporadic epidemics and kits were developed (or almost finalized) very quickly and research continues with very recent publications (in the United States and in China).
It takes time to move from research to a commercial product as shown by the woes of American tests (here and there): this quality problem continues as two Australians that had tested negative turned out to have been infected with the coronavirus. At the peak of the epidemic, China was in dire need of testing kits.
Cases in China Outside Wuhan and Hubei
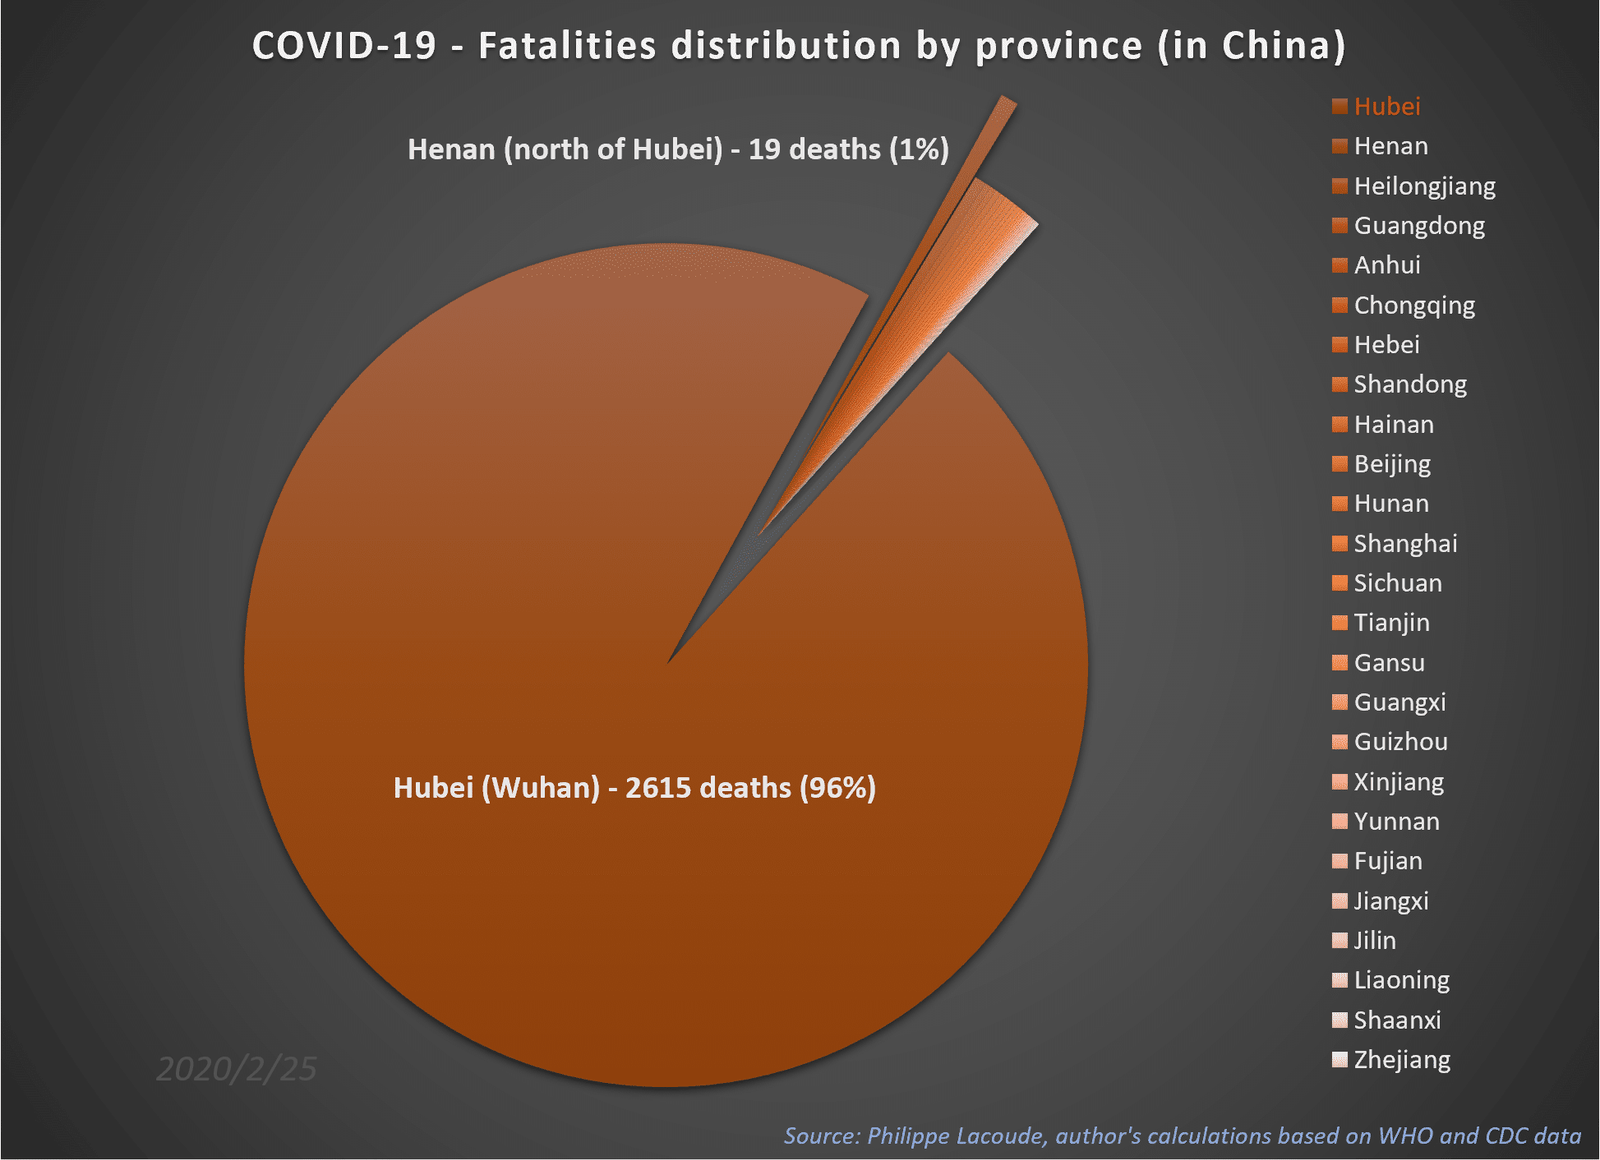
In China, the distribution of the disease is strikingly concentrated. In fact, the province of Hubei accounts for more than 96% of all deaths because almost all cases (80%) are concentrated there. The second most affected region – Henan, Hubei’s immediate northerly neighbor – accounts for only 0.70% of all deaths and 1.56% of all cases.
It is also remarkable that the further you go from the Hubei province, the fewer cases there are. If the health authorities in Wuhan had not sought to mask the extent of the disaster, it is not impossible that the epidemic would already have been brought under control. No Chinese province – apart from Hubei and Henan – has suffered more deaths than Iran or Italy.
These remarks are reinforced by the fact that in Chinese provinces other than Hubei, there are enough RNA tests: therefore, the number of cases proven by RNA PCR reagent tests encompasses all the epidemiological data. Outside Hubei, there is not as much difference between the proven cases and the reality on the ground.
Conversely, Wuhan hospitals are completely overwhelmed by the unfolding events. This is reflected in the fact that its local death rate is probably close to 4%, while certain Chinese provinces are just under 1%. In Wuhan, it has become impossible to put all the patients who need it on a ventilator.
In a study on the epidemiological dynamics of the different provinces, American and Chinese researchers found that “the epidemic was self-sustained for less than three weeks with [a reproductive ratio] reaching peaks between 1.40 in Shenzhen City (south of the country, Guangdong province) and 2.17 in Shandong Province. In all the analyzed locations (n=10), [the reproductive ratio] was estimated to be below the epidemic threshold since the end of January.”
COVID-19: Peak in China?
All the above suggests that the epidemic has peaked in China: in another model, the daily incidence of COVID-19 fell to less than 1% as of February 25 for China and Hubei province. Calculations showed that the peak would be reached on March 8 for the city of Wuhan. The daily incidence of new cases is said to have peaked in China, Hubei and Wuhan, but with different descending slopes.
In their details, these models leave room for future increases because the confidence intervals are quite wide. They cannot exclude future increases although they are statistically unlikely: “Although the national peak time has been reached, a significant proportion of asymptomatic patients and the infections of super-spreading events still exist in the population, indicating the potential difficulty for the prevention and control of the disease.”
As folks return to work, other measures will be particularly crucial in stopping the COVID-19 epidemic in other cities besides Wuhan.
One can indeed wonder if the epidemic will not simply start again as soon as the population returns to normal behaviors (here).
Explosion in the number of cases outside of China
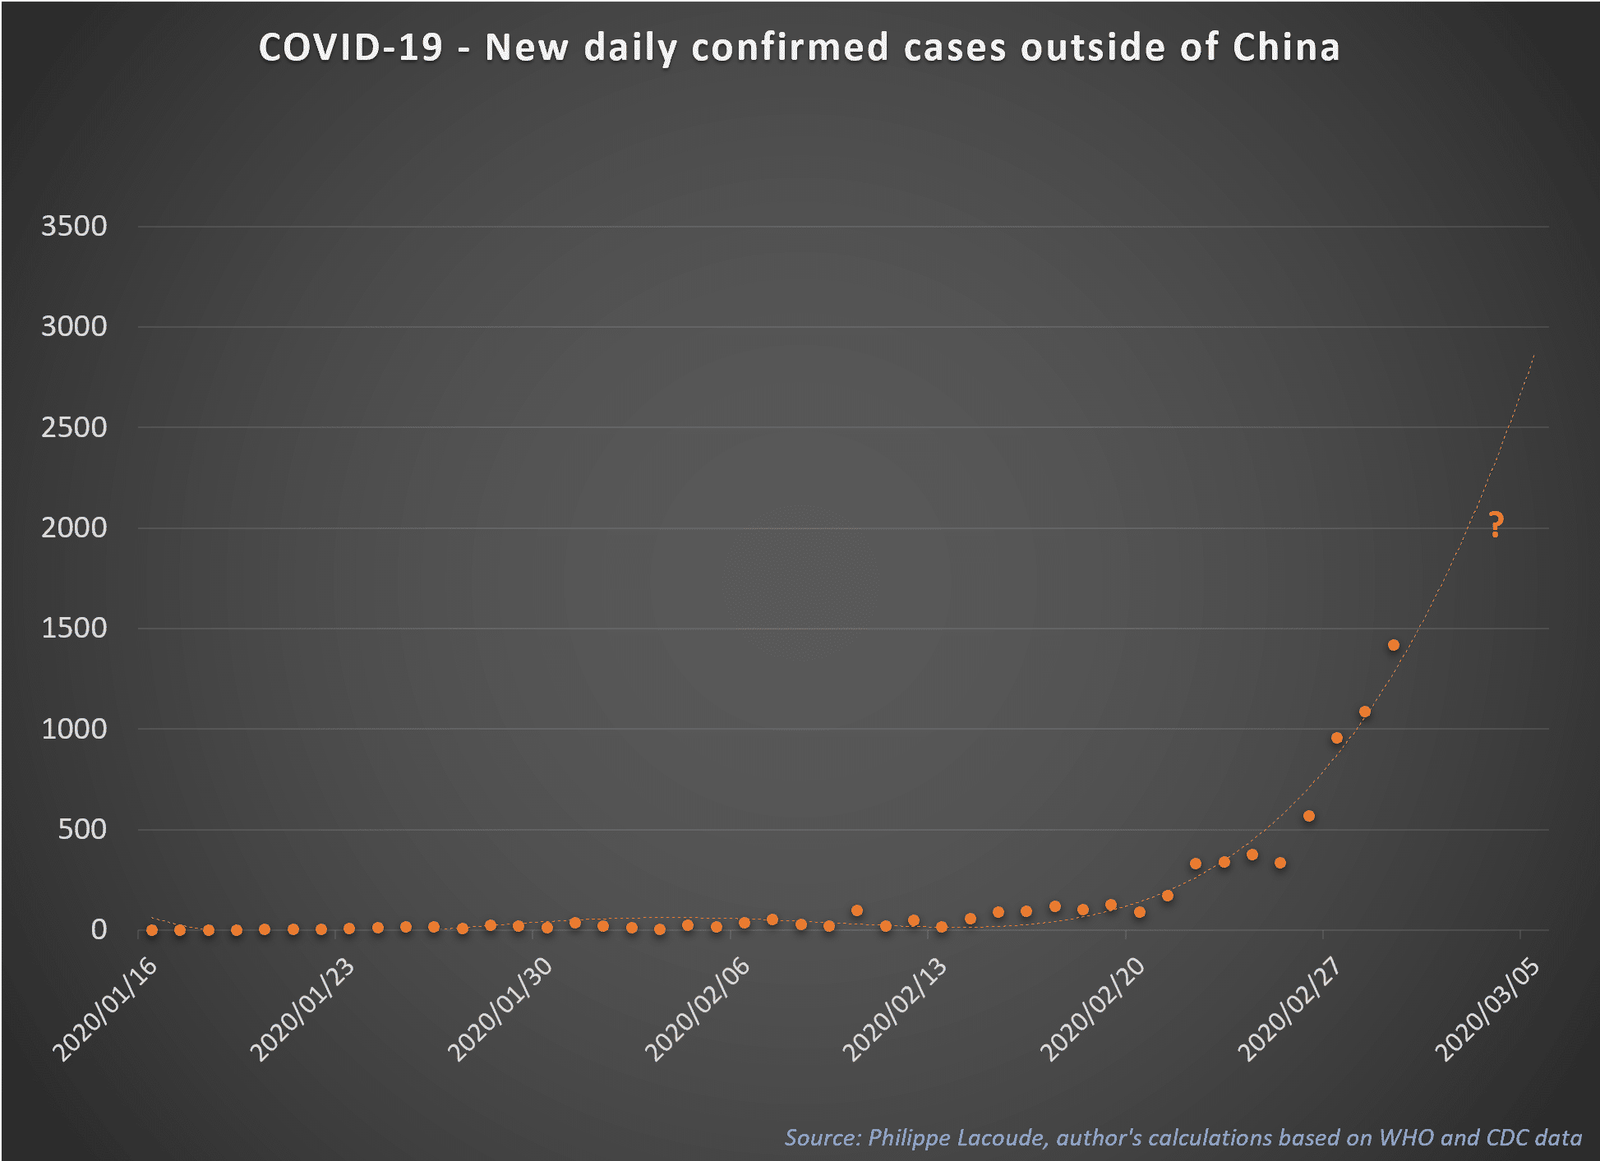
In spite of the decline in China, we are facing an explosion in the rest of the world that was, alas, predictable: we knew that there is a 37% probability that an imported case, – i.e. a Chinese carrier traveling abroad – is followed by a sustained human-to-human transmission. If 10 Chinese from mainland China landed in Narnia with the virus, they probably infected 3 or 4 Narnians there.
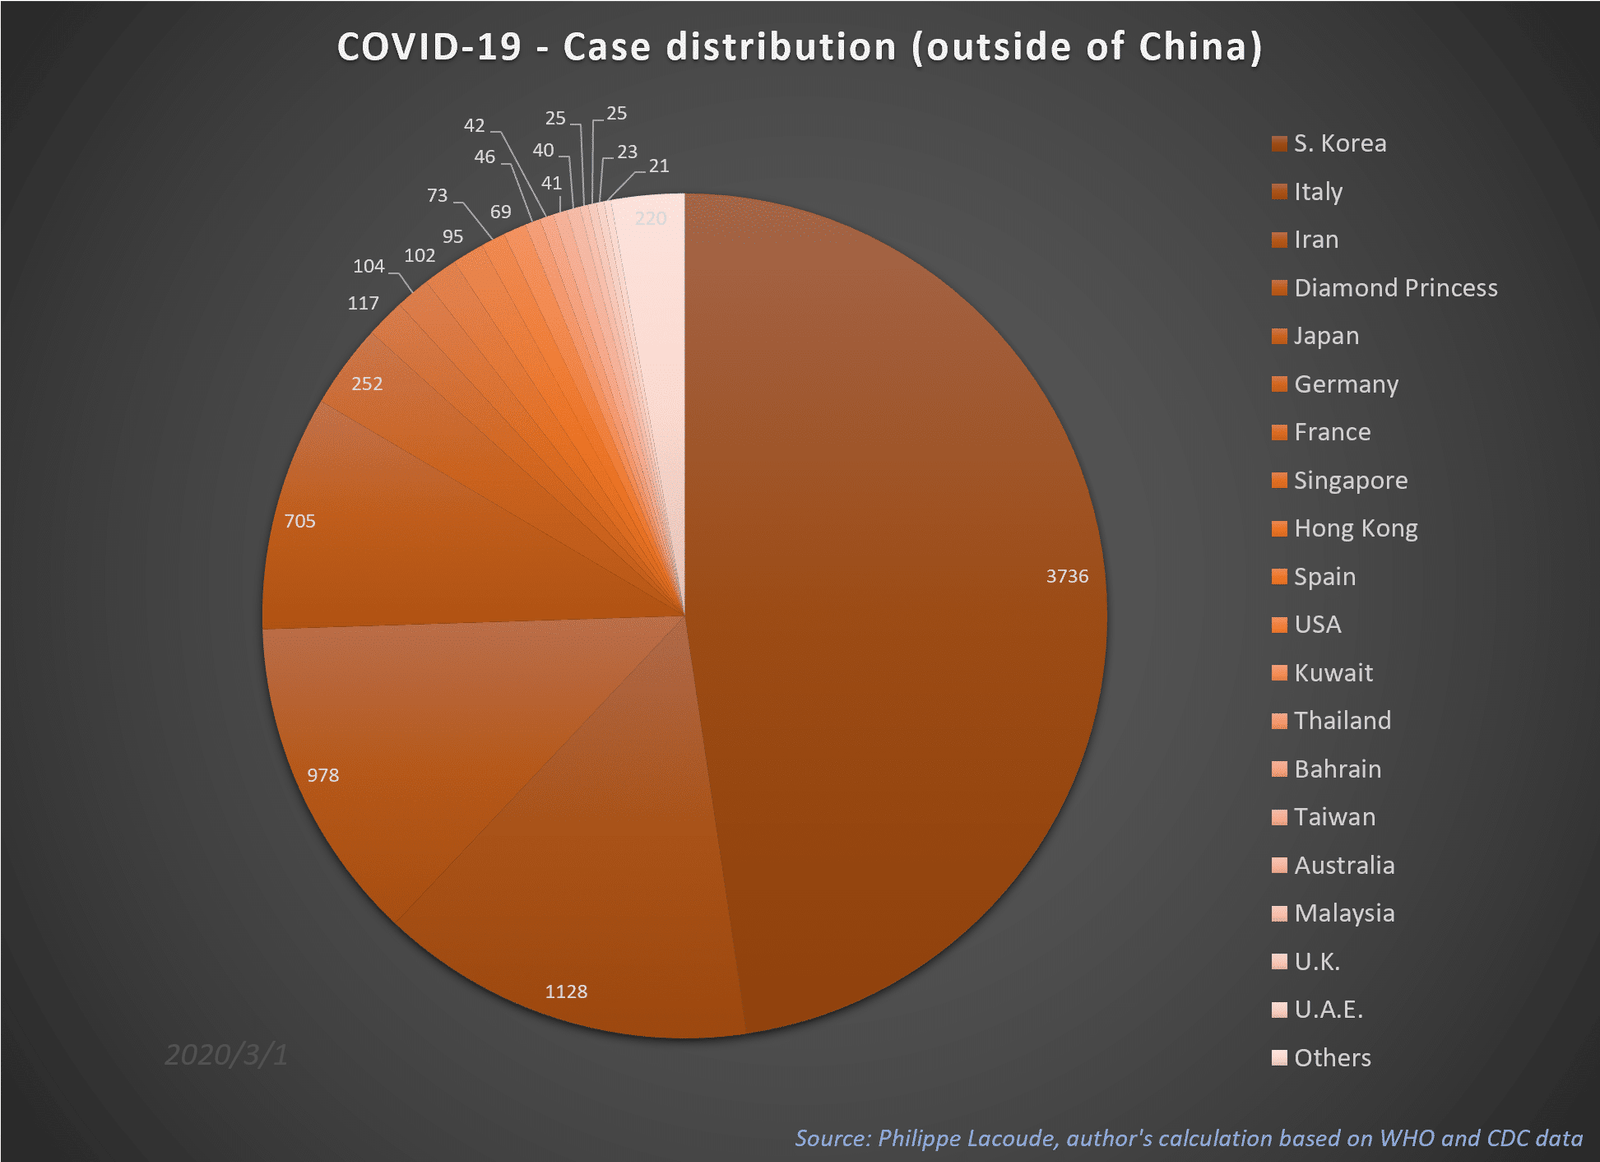
The situation is now serious in South Korea, which initially took matters quite lightly. With nearly 3,736 confirmed cases as of March 1st, 2020, the country is starting to wake up now that the American bank JP Morgan Chase estimates that the number of infections could reach 10,000 people in the coming days.
On February 25, Iran acknowledged 95 cumulative cases (including the Deputy Health Minister!) and 16 deaths. Because it is more difficult to hide a corpse than a mildly sick patient, the second figure may be less deceitful than the first. But it must be understood that a disease that kills about 2% of its victims – on average 14 days after the onset of the first symptoms – if it caused 16 deaths on a certain date must have affected 800 people 14 days before!
We can therefore reasonably think that Iran had 800 patients with COVID-19 as of February 11. For comparison, by the time the Henan province of China has had 19 deaths, it had 1,271 cumulative confirmed cases. Assuming the figure of 16 is not a gross underestimation, that means that if the disease progresses as quickly as in China – and why should it be different? – we already have at least 31,000 patients in Iran as of February 25 and certainly not the bizarre figure of 95 cumulative cases.
The same goes for Italy. If the 11 deaths recorded on February 26, 2020 were all due to COVID-19, there should have been approximately 550 cases – assuming of a death rate of 2% – as of February 12, 2020 and this country could not therefore not have “only” 323 cases as of February 26. The number of actual cases in Italy must be at least three times higher than the number of reported cases.
Transmission and Incubation
In the middle of January 2020, scientists thought that the basic reproductive ratio of the virus was between 2.2 and 2.7 (for example, here). Each patient infected on average two others: in the Lancet article, the basic reproductive ratio R0 is 2.68 (with a 95% CI of 2.47 to 2.86) and the estimated doubling time of the epidemic is 6.4 days (with a 95% CI of 5.8 to 7.1 days).
These optimistic figures did not last. At the end of February 2020, it became clear that R0 may be above 3.0: Swiss researchers gave an interesting probability distribution in their paper (Figure 1) and showed that the SARS-CoV-2 is probably more contagious than the Spanish flu of 1919 or than the MERS-CoV (Figure 2).
At the start of the epidemic, the number of cases doubled every 2.4 days and the R0 value must have been between 4.7 and 6.6. According to the researchers, quarantine and monitoring contacts of symptomatic individuals alone cannot be effective: rigorous control measures are necessary to stop the transmission of the virus, as Italy, Iran and South Korea are now finding out the hard way.
Adding to these disturbing facts, the asymptomatic incubation is quite long. Preliminary studies (here, here and there) had shown an average incubation time of 4.8 to 7.4 days using data from the first three weeks of January. A peer-reviewed paper from the New England Journal of Medicine is now reporting an almost identical average of 5.2 days (with a 95% CI of 4.1 to 7.0 days) but highlights an interesting fact: 5% of cases have an incubation period of more than 12.5 days!
In the case of the Diamond Princess cruise ship, if we add these two facts to confinement on board, we understand very well how the 3710 people all passed their virus to each other: this fiasco is only a repetition of the sad story of doctor Liu Jianlun who infected 23 people who stayed on the same floor of his hotel in Hong Kong in 2003 during the SARS epidemic. This cruise ship, which involuntarily became a giant laboratory, has confirmed that almost a third of the SARS-Cov-2 infections are asymptomatic and that most of them had occurred before the quarantine of two weeks.
Very Infectious?
The COVID-19 infection rate is therefore much higher than that of SARS (2002-2003) or MERS (2012-2019). COVID-19 only took 90 days to infect 8,000 people compared to 230 days for SARS. In one year of existence, MERS had only infected 108 people.
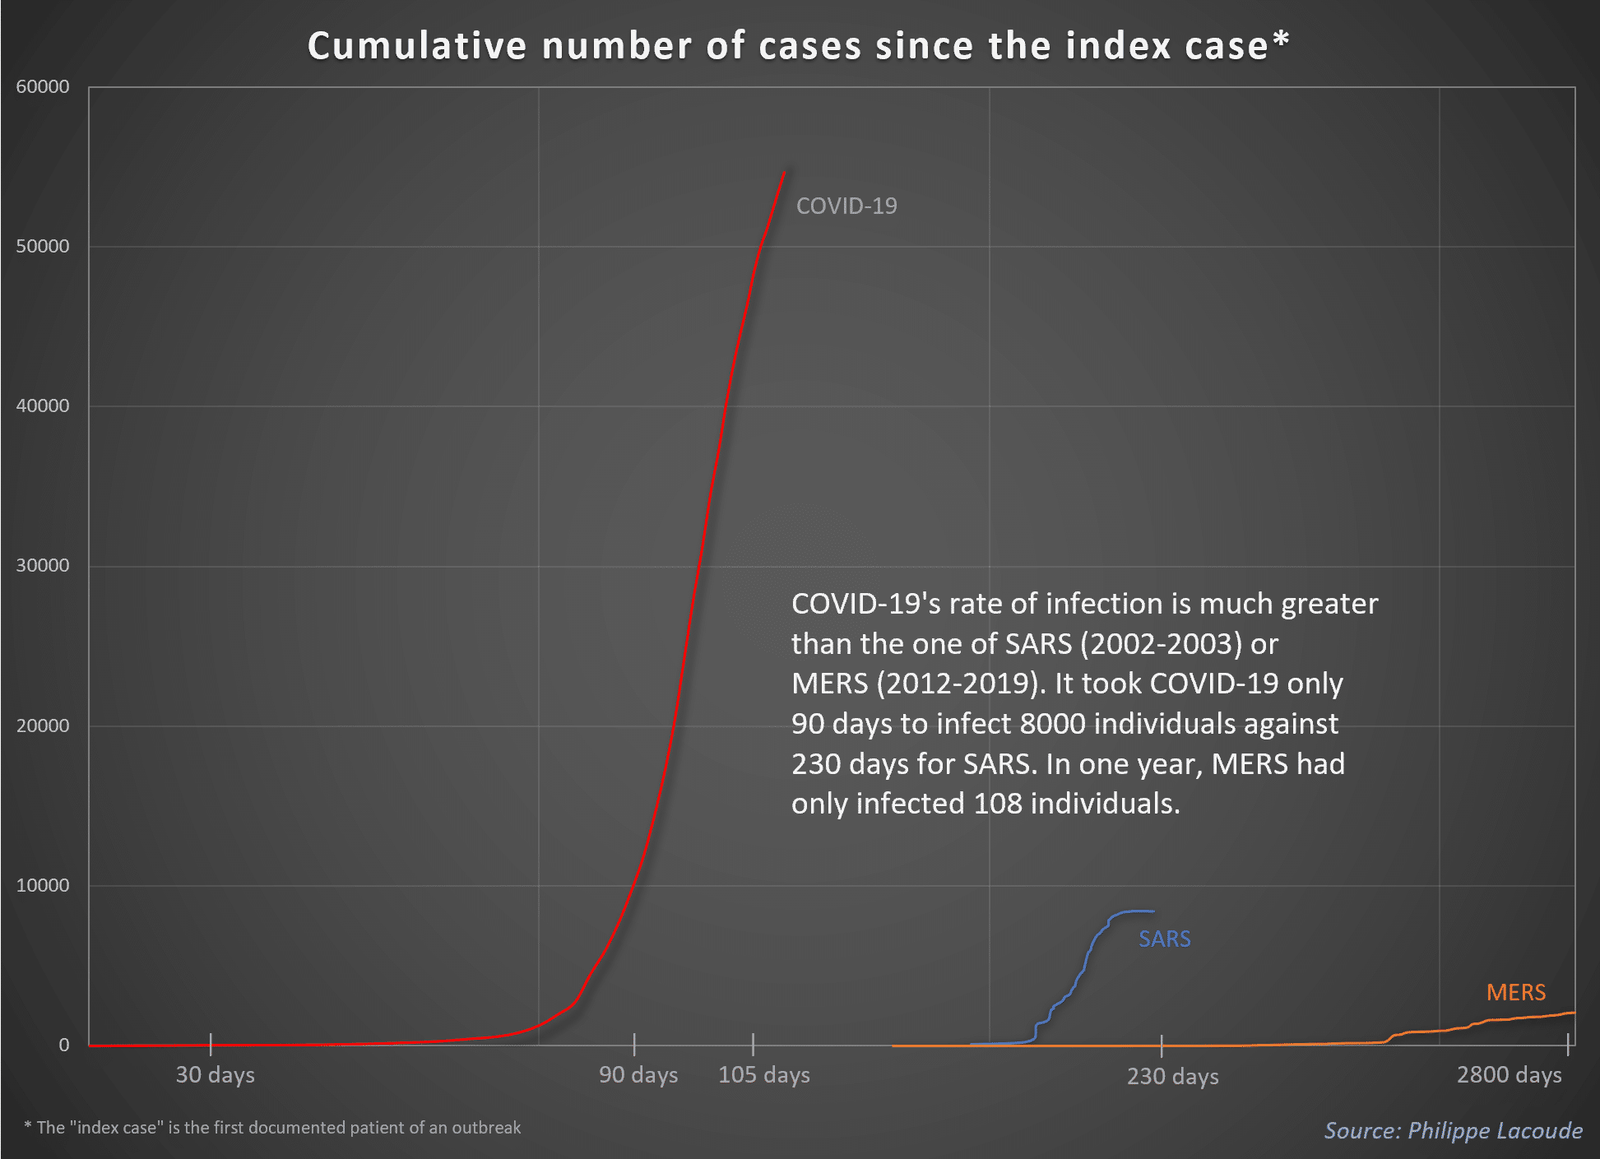
In view of the graph above and given the explosion of cases in several countries, we can wonder whether the epidemic can still be contained.
Number of Deaths
The infection rate is not the only problem. The death rate is also very high. No study reports a mortality rate of less than 1% and others go so far as to propose a rate of 4.3% (here, here and there).
Wuhan University researchers have even calculated a case fatality rate (CFR) of 7% based on the 70,548 proven cases available to them: of course, as they explain (page 7), the greater the number of unrecorded benign cases, the lower the real mortality rate.
The mainstream press repeats that this virus mainly affects older people. While this is true, the fact remains that it kills almost 0.2% of the 20-40 age cohort!
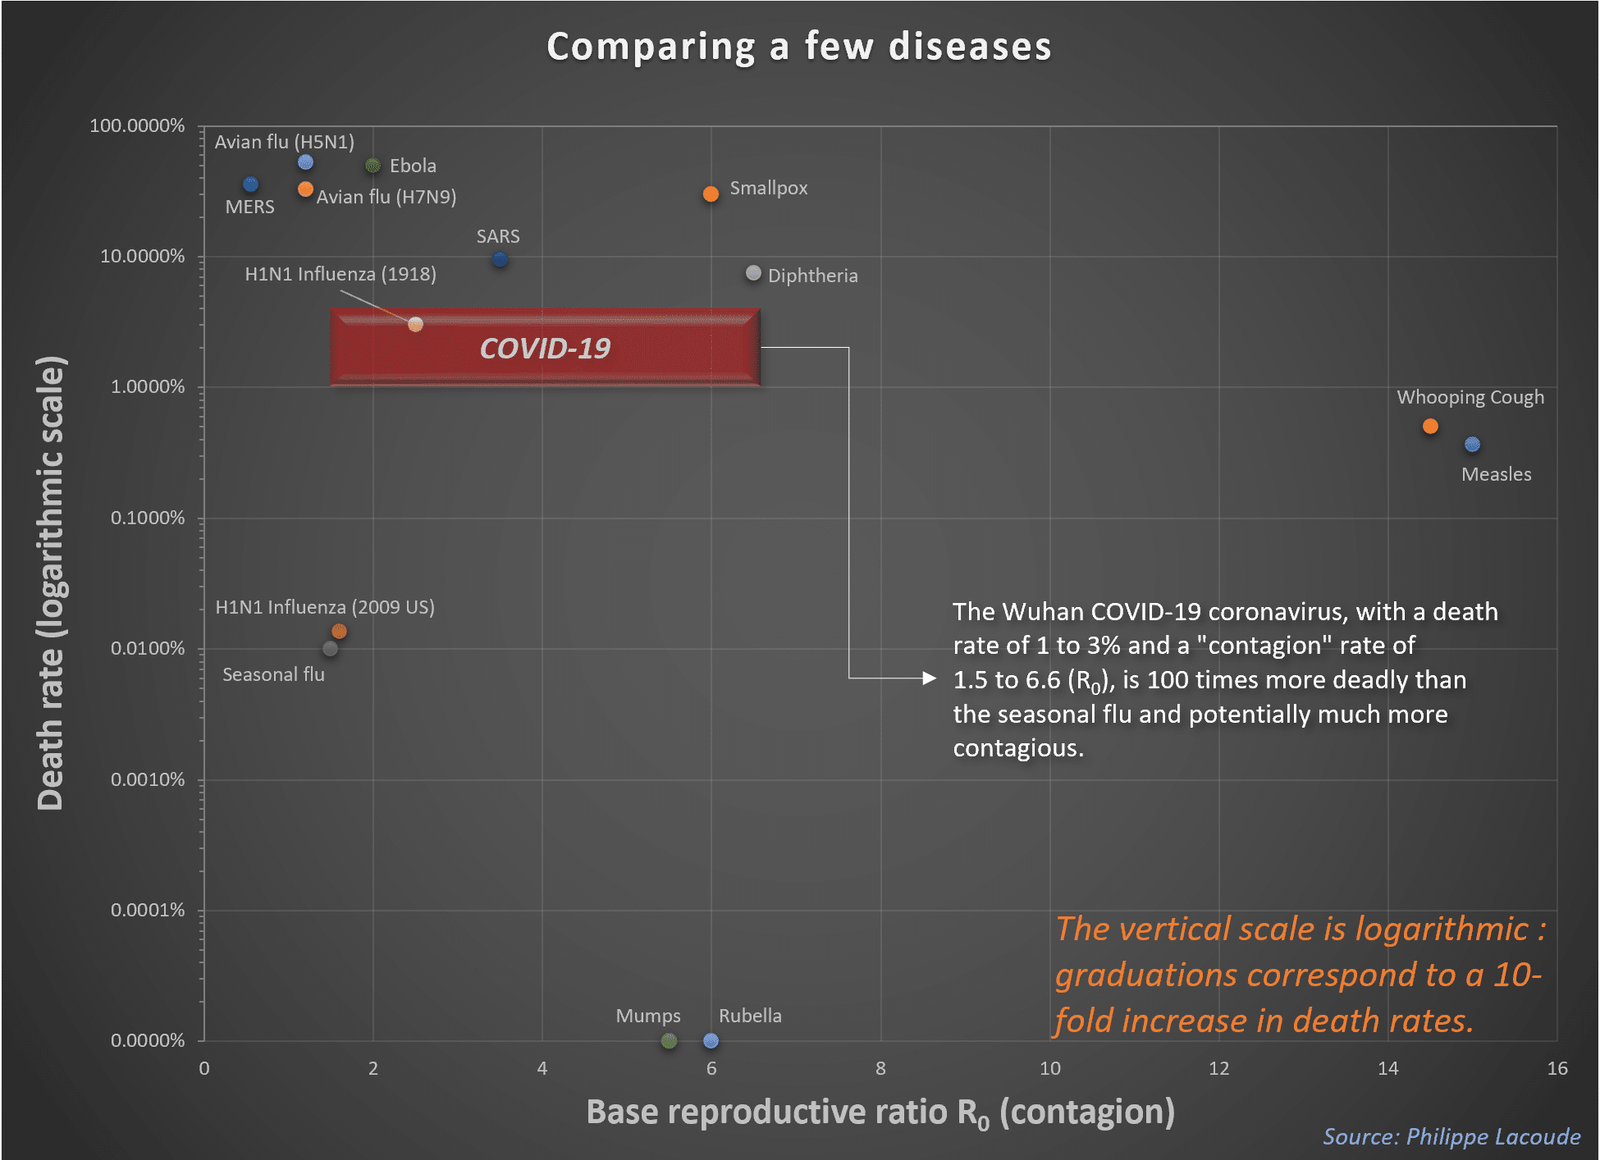
As such, comparisons with the flu are inaccurate. Seasonal flu has a case fatality rate (CFR) of strictly less than 0.1% according to the Centers for Disease Control and Prevention (CDC). In fact, because most influenza-related deaths are due to concomitant opportunistic bacterial infections and because the denominator (estimated actual cases, clinical cases, or laboratory-confirmed cases) varies wildly, actual flu CFRs have statistically very large confidence intervals.
One of the most studied strains of influenza is the 2009 influenza (H1N1) pandemic. In a 2013 meta-study – summarizing 50 peer-reviewed studies (selected among 12197 potential citations!) –, researchers showed that its CFR was ranging from as low as one case per 100,000 (0.001%) to well above 13,485 cases per 100,000 (13.485%).
All depends on the definition of the number of cases: on the basis of estimated infections, all studies show 1 to 10 deaths per 100,000 cases, i.e. less than 0.01%. The CDC itself estimated that this pandemic affected 60.8 million patients (with a CI of 43.3 to 89.3 million) and led to 12,469 deaths (with a CI of 8,868 to 18,306) in the United States from April 12, 2009 to April 10, 2010. This would put the CFR between 0.01 and 0.04%.
A 0.01% death rate for the flu is 100 to 300 times lower than that of COVID-19.
The basic reproductive ratio of the influenza is generally barely above 1.0 which means that the epidemic stops by itself without drastic measures. Conversely, the basic reproductive ratio of COVID-19 is at least 2.5 according to the lowest estimates and could well be as high as 6.6 according to the highest estimates mentioned above.
In addition, there are (imperfect) vaccines and antivirals against the flu that are not (yet) available for COVID-19.
At least a hundred times more deadly, much more contagious than the seasonal influenza, and without effective drugs, COVID-19 has not (yet) claimed more victims than it already has thanks to the extremely restrictive measures taken against it (such as the cremation of bodies).
Pandemic?
As early as January 27, when the virus had infected only 2,700 people in China and killed 81 of them, a team of scientists from the University of Hong Kong had warned in a briefing that the spread of the deadly SARS-like virus which had appeared in the Chinese city of Wuhan was gaining momentum. “We have to be prepared that this particular epidemic may be about to become a global epidemic,” said Gabriel Leung, head of the team, at the time. “Substantial, draconian measures limiting population mobility should be taken sooner, rather than later.“
It is becoming difficult to circumscribe this new disease to China. At this point, like AIDS or the other 4 known human coronaviruses (229E, NL63, OC43, HKU1), for example, it could remain with the human species indefinitely or at least until a vaccine is found.
For the moment, all the different RNA sequences of the virus are very similar: it has not yet mutated in a human organism even if some researchers ponder the opposite (here and there). One problem would be that, eventually, it mutates and becomes a series of similar but not identical strains, such as HIV-1, HIV-2, HIV-3, or such as the different strains of the flu. It would in no way be the end of homo sapiens but it would be a serious impediment.
At some point, health authorities will realize that the containment has failed – if it does… – and we will have to abandon the collective measures and move to individual measures. Avoid mass gatherings without direct productive outcomes, adopt remote work for those who can, generalize distance education, adhere to rigorous prophylaxis…
Ultimately, the solution will probably come from medicine rather than the anti-economic confinement of entire cities by the police. As usual, if or when the situation becomes desperate, economic progress will provide the solution to the problem.
Henceforth, the most promising news is the very rapid reaction of academic and private organizations. A handful of people are making an enormous impact towards a cure:
- Several companies immediately developed ready-to-use COVID-19 primers (here and there) and anybody can purchase small strands of RNA to develop PCR assay reagents for COVID-19 research.
- The race is on among at least ten actors to provide rapid RNA tests for SARS-CoV-2. International teams made these tests available in record time: the market for RNA tests is now vibrant and biotech firms are shipping imperfect but improving competing products in industrial quantities. The U.S. Food and Drug Administration is fast-tracking administrative procedures.
- In China and in the United States, several trials of known broad-spectrum antiviral agents are now in phase 3 or 4 testing for COVID-19 infected patients. The idea was to use existing drugs with already known side-effects and posology against this particular coronavirus: Gilead is testing its Remdesivir (phase 3) while competitors are trying Arbidol (phase 4), Lopinavir (phase 4), hydroxychloroquine (phase 3), and Ritonavir (phase 3).
- In parallel, Moderna is starting trials on the first vaccine – developed in only 42 days using artificial intelligence. The first batches have been sent to the National Institute of Allergy and Infectious Diseases (NIAID), an agency of the National Institute of Health. The small company is in fierce competition with pharmaceutical giants Johnson & Johnson and GlaxoSmithKline.
In any case, this epidemic will come to dominate the 2020 news cycle and whatever the outcome of this crisis, history books will probably say that the final result played out in early February 2020.
This story has been originally published in French media Contrepoints.
This post is also available in: DE (DE)
Do you have the genomic sequence for the SPIKE protein; from the NH2-Signal Peptide through the end of the S2-COOH Domain ?
This info in invaluable as I am developing the quintessential vaccine for
COVID-19………….previously, I was the pivotal scientist for the development of PREVNAR-13. Please help !…ASAP.
Dr. Mike Huchital, Chairman& CHief Scientific Officer
DYNE IMMUNE INSTITUTE for TRANSLATIONAL MEDICINE & RESEARCH
tel # 845 252-5010
My background is in statistics and dynamic modeling. Not in genetics at all. So I only understand your question in its vaguest of terms (as I know about the spike protein and its role but I am at loss as to what the locations NH-2 and S2-COOH refer to).
But the authors of these articles should have that since they compare the code of the spike protein in SARS-Cov-2 and SARS-Cov in these papers:
1. https://www.biorxiv.org/content/10.1101/2020.01.28.923011v1.full.pdf (page 11)
2. https://www.biorxiv.org/content/10.1101/2020.02.19.956581v1.full.pdf (fig 1 C-D)
https://www.ncbi.nlm.nih.gov/genbank/sars-cov-2-seqs/#reference-genome
Hurrah! Finally I got a weblog from where I be capable of really get
valuable data regarding my study and knowledge.