Here is the third and concluding part of the series authored by Professors Furfari and Mund. Beginning with an exploration of the escalating global demand for electricity, they delved into the historical significance of nuclear energy in the previous installment. This final segment is devoted to examining the future of nuclear energy in the EU, raising the question of whether there will be a resurgence in the relevance of the Euratom Treaty’s spirit ?
Is Europe on the way to a deleterious lock-in?
The European Union was born based on the ECSC and Euratom treaties respectively in 1951 and 1957. These treaties aimed to create an internal market for coal and steel and to promote civil nuclear energy respectively. Until recently, the European Commission was the guardian and promoter of the latter. Under the influence of a very hostile Germany, the Commission has gradually withdrawn from the latter.
By choosing to promote renewable energies ‘whatever it takes’ and by abstaining from taking a proactive position in favour of nuclear energy as required by the Euratom Treaty, the European Commission is weakening further continental development of the technology at the expense of variable and intermittent renewable energies. Preconditions for future locking in favour of the latter are in place while several environmental indicators are in favour of nuclear energy like power plant footprints, material requirements (concrete, metals, cement, glass and others) and system costs. These are the most obvious parameters but there are more subtle elements as well. Unlike variable and intermittent renewables, nuclear reactors do not create geopolitical dependence on China, which dominates the market for rare earths and other metals that renewables equipment need for production, as we will see below. Renewable energies lock-in would not only be detrimental for environmental reasons but also for geopolitical reasons.
Table 1 compares the power footprints (expressed in m2/GW) of nuclear plants and intermittent renewable energy sources based on data collected in a very large geographical area (Deshaies, 2020). Intermittent renewable energy sources have very low power density compared to classical sources. This implies much larger footprints than nuclear plants. The ratio depends on both location and technology and goes approximately from 200 to 1000.

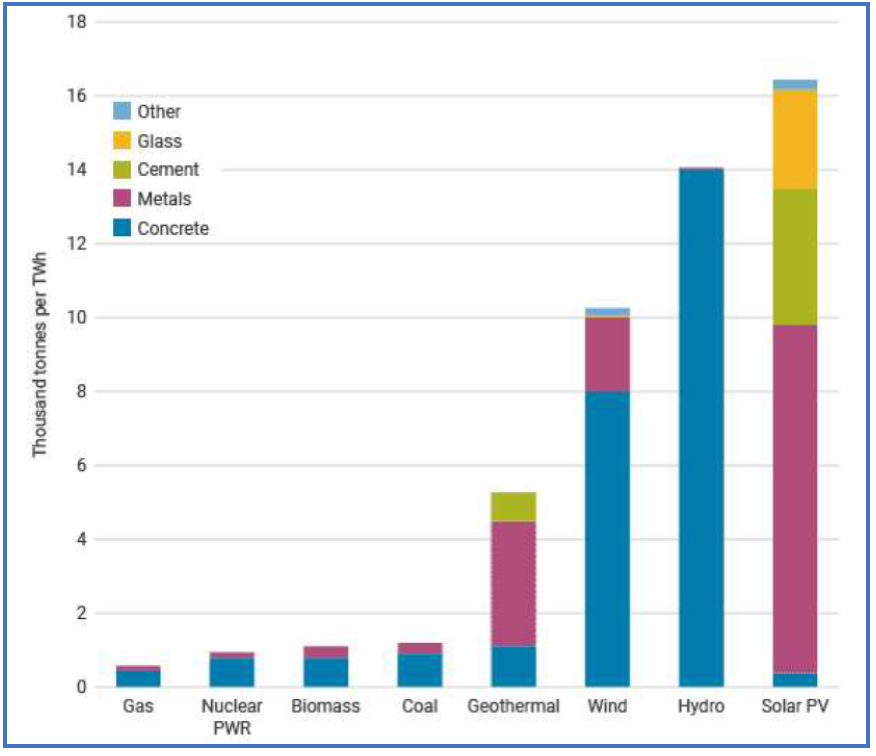
Figure 10 shows the basic material requirements (excluding fuel resources) for the implementation of energy technologies, including nuclear and renewable energy. These requirements are expressed in thousands of tonnes per TWh. Here again, nuclear power has advantages over variable and intermittent renewables. Despite the considerable quantities of concrete that are invested to guarantee the safety of the nuclear installations, these quantities are lower than those required by wind power; and much lower still than those invested in the construction of dams. Careful attention should be paid also in the quantities of metals, cement and glass required by solar photovoltaics. In absolute terms, solar PV requires the most material resources.

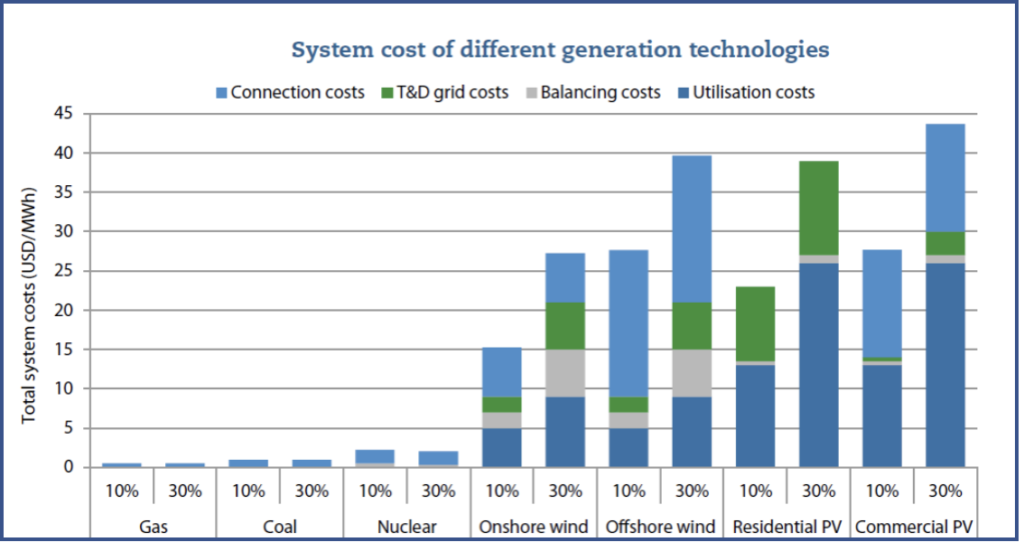
Finally, the cost of these technologies has been extensively studied by the OECD’s NEA agency. In a report entitled ‘The Full Costs of Electricity Provision’, the agency inventories the different components of the cost of production (see OECD-NEA, 2018). This is particularly important for intermittent generation (wind, solar PV) which faces supply difficulties in the event of a prolonged intermittency. To guarantee the supply of demand, variable and intermittent renewable energies must be replaced by controllable means which themselves represent a cost and whose profitability is not necessarily optimal. All these elements guaranteeing security of supply are to be classified (from a cost point of view) in what the NEA calls the system cost. More than the costs of production, operation and maintenance, it is the system costs that make the difference between these different technologies (controllable and intermittent). This is illustrated in Figure 11 from the NEA report. The system cost (in US$/MWh) is shown for controllable (fossil, nuclear) and intermittent (wind, solar PV) technologies for two penetration rates of the latter in the electricity system. It should be noted that the system cost is made up of different elements, namely connection, transmission and distribution, grid balancing and usage costs.

It is not surprising to conclude that controllable production like nuclear is the most interesting economically.
All three elements of comparison (footprint, materials and costs) point in the same direction: nuclear technology is preferable to variable and intermittent renewables. Of course, in the studies referred to, Generation-II technology was used to assess the various parameters. The forthcoming arrival of Generation-IV should not fundamentally change the conclusions. And, as mentioned earlier, the inherent safety of future nuclear power should make the technology more attractive. The biggest hurdle to overcome will be the psychological one, as an instinctive fear of radiation permeates the public mind.
The take-off of nuclear power in France
President Emmanuel Macron has decided to relaunch the development of nuclear energy in France. EDF has been asked to develop its second-generation EPR (EPR 1660 MW and 1200 MW). But France also wants to develop SMRs and has therefore decided to launch an ambitious project to develop this size of reactor, but with different technologies (GEN III and GEN IV) to produce different types of output.
EDF is preparing NUWARD, a 340 MW GEN3 with two reactors.
In addition to Nuward, 8 SMRs have been selected as part of Bpifrance’s ‘Innovative Nuclear Reactors’ call for projects: 4 RNRs, 2HTRs and 2 specific reactors (1 fusion reactor and 1 with dedicated heating). BpiFrance, the French Public Investment Bank, helps businesses to think bigger and further ahead. From seed capital to stock market listing.
- Naarea: fast neutron reactor with molten salt coolant
- Newcleo: fast neutron reactor with lead coolant
- Jimmy Energy: high-temperature reactor (HTR)
- Renaissance Fusion: nuclear fusion in a stellarator
- Calogéna: light water reactor dedicated to district heating
- Hexana: sodium-cooled fast neutron reactor
- Otrera Nuclear Energy: sodium-cooled fast neutron reactor
- Blue Capsule: sodium-cooled fast neutron reactor
It is interesting to note that nuclear energy is becoming an attractive option for heat production. This article stresses the need for nuclear energy to meet the massive future demand for electricity. However, it should be remembered that heat accounts for almost half of the final energy demand in the EU. Therefore, if new nuclear reactors can produce heat for industrial or district heating in addition to electricity, they will help to reduce the demand for fossil fuels in this key sector, which is still heavily dependent on flames.
Conclusion
Evolution and transition of technologies are processes that take time. There are many reasons for this: technical, commercial or other. The great successes of the past make today us forget that at the time they took place, things were far from simple, resistance to change being always present for many reasons, including commercial ones. This was particularly the case in Drake’s time (1859), at the beginning of the industrial era of rock oil, a competitor to coal oil, turpentine and whale oil, especially for lighting (Rhodes, 2018). The use of this commodity eventually took off in the transport sector.
In the case of Generation-IV nuclear power discussed in this work, the time needed for future deployment of this technology is related to its fine-tuning. Its advantages over Generation-II and Generation-III technologies are known, and previous successful implementation only reinforces the attractiveness of the new technology. The biggest hurdle to overcome will be the psychological one, as an instinctive fear of radiation permeates the public mind in the West.
This fear is far from universal: what will the EU do if it is confirmed that in 20 years’ time the rest of the world, having not taken part in the ‘monoculture’ of variable and intermittent renewables, will have taken a serious lead in these new technologies, which are free of the main shortcomings of current installations – accident risks, long-lived waste – and have eminent environmental qualities? To ignore this possibility is to set up a pernicious lock-in that future generations may regret. Very paradoxically, for essentially environmental reasons…
End of Part 3/3
Read part one : Nuclear power takes off (Part 1 ): meeting the growth in global electricity demand
Read Part 2 : Nuclear power takes off (Part 2): the ongoing evolution of reactors
Data availability statement
Data sharing is not applicable to this article as no datasets were generated or analysed during the current study.
References
Deshaies M. (2020), Geographical problems of energy transitions: what perspectives for the evolution of the energy system? Developing Worlds, 2020/4 (No. 192), pages 25–44.
OECD-NEA (2018), The Full Costs of Electricity Provision, https://www.oecd-nea.org/jcms/pl_14998/the-full-costs-of-electricity-provision
Iconographie : Affiche italienne célébrant la signature, le 25 mars 1957 à Rome, des traités instituant la Communauté économique européenne (CEE) et la Communauté européenne de l’énergie atomique (CEEA ou Euratom) présentés comme la base pour la paix et le progrès en Europe. Source: COMMISSION EUROPÉENNE, DG X. Représentation de la Commission européenne au Luxembourg (sous la dir.). Europa Grafica, Unir des peuples. Associer des États Nations : Exposition Europa Grafica; Luxembourg, du 29 avril au 14 mai 1995. Luxembourg: Office des publications officielles des Communautés européennes, 1995. 130 p. p. 21.
Copyright: (c) Europa Grafica – Commission européenne Représentation au Luxembourg
End of the article. Read part one and part two
Nuclear power takes off (Part 1 ): meeting the growth in global electricity demand
Nuclear power takes off (Part 2): the ongoing evolution of reactors
The figure 11 is not correct. Its title must be “Grid-level system costs…”.
We can see that the numbers are very low, less than 4.5 c/kWh.
The correct figure for the whole system costs would be with the “Plant-level costs…” with higher numbers (between 3 and 37 c/kWh) which correspond to the reality of the real total system costs and not only the additional costs due to the grid.
The figures ES.3 with the partial costs, reproduced here from the original Report of the IEA/NEA 2015, must be replaced by the figure ES.2 with the total costs