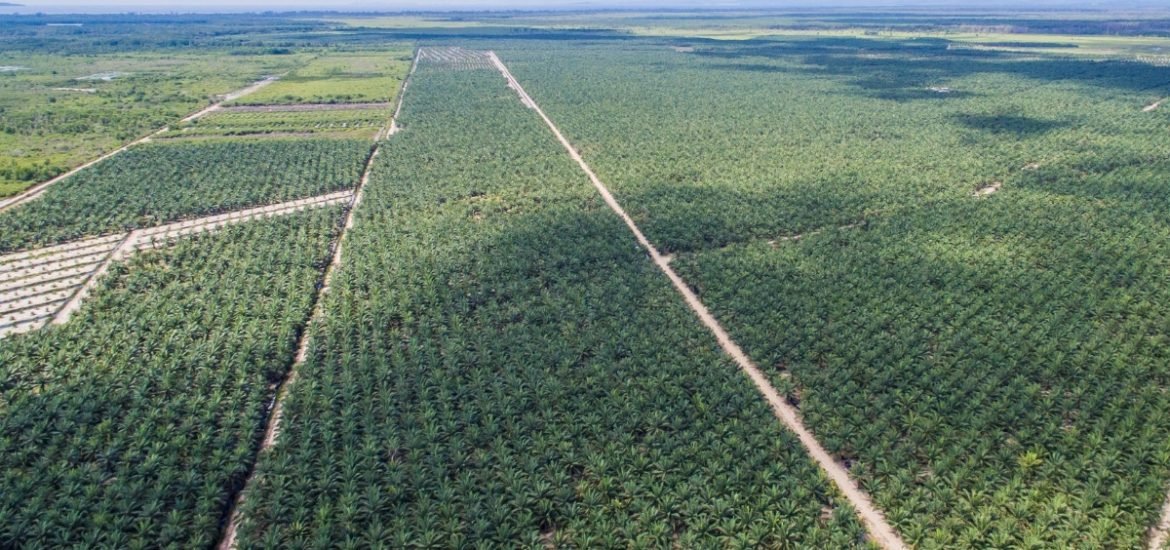
A new analysis published on 14 September in Science has revealed that around 50 thousand square kilometres of forests are being cleared every year to make way for industrial agriculture. Moreover, despite pledges by companies to help reduce deforestation, no changes in the amount of forest cleared for palm oil plantations and other lucrative crops were observed between 2001 and 2015 (1).
The study reports that “just over a quarter of global forest loss is due to deforestation through permanent land use change for the production of commodities, including beef, soy, palm oil, and wood fiber.” It further concludes, “Despite regional differences and efforts by governments, conservationists, and corporations to stem the losses, the overall rate of commodity-driven deforestation has not declined since 2001.”
The analysis was aimed at assisting corporations in identifying wood fibre source regions and regions of deforestation due to commodity agriculture. Deforestation is defined as clearance the removal of a forest or trees for the purpose of converting the area into non-forest use, for example, conversion to farms, ranches, or urban use. However, loss of forests can also be caused by events such as wildfires, as well as selective logging practices.
In 2013, a team led by Matthew Hansen, a remote-sensing expert from the University of Maryland in College Park, created the Global Forest Watch platform containing detailed maps of global forest loss and regrowth between 2000 and 2012 based on satellite imagery (1). The high-resolution maps illustrate the scale and magnitude of forest loss, but they do not paint a picture of why this is happening. Distinguishing between permanent conversion and temporary losses from forestry or wildfires is hugely important for helping decision-makers from governments, companies, and non-profit organizations assess deforestation risks and develop better policies.
The new analysis, led by Philip Curtis, a geospatial analyst working with the Sustainability Consortium, a nonprofit headquartered in Fayetteville, Arkansas, made use of high-resolution Google Earth imagery to classify nearly 5000 training sample cells. By using a decision-tree model, the team was able to predict the most likely causes of forest disturbances within any 10 km x 10 km region around the world starting in the year 2000. The decision tree was trained to recognize five causes of forest loss from satellite images: wildfire, logging of tree plantations, large-scale agriculture, small-scale agriculture, and urbanization.
According to the analysis, drivers of forest loss vary regionally, with forestry and wildfire being the dominant disturbance factors in temperate areas, whereas shifting agriculture and commodity-driven deforestation was foremost in the tropics. Widespread deforestation for agricultural expansion was observed in Indonesia and Malaysia mostly owing to oil palm plantations. Most of the forest loss in Central and South America was due to row crop agriculture and cattle grazing and in sub-Saharan Africa, agricultural shifts were the main drivers.
The authors suggest there is scope to look more closely on a regional and local scale in order to identify the key drivers such as specific row crops or tree plantations, which would enable a more detailed supply chain analysis to identify corporate risk and responsibility from commodity-driven deforestation. However, the study clearly highlights the fact that corporate commitments are not enough to protect forests from expanding agriculture.
(1) Curtis, P.G. et al. Classifying drivers of global forest loss. Science (2018). DOI: 10.1126/science.aau3445
(2) Hansen, M. C. et al. High-resolution global maps of 21st-century forest cover change. Science (2013). DOI:10.1126/science.1244693pmid:24233722